This coming fall I have to drive between St Paul and New York, and then back again. I love rotisserie chicken and slowly collapsing fast casual chains. We both know where this is heading. How many conveniently located Boston Market's are there along my drive? Can I live my dream of eating Boston Market for all 12 meals of the journey? Will they let me have extra skin? Today, on the Web Blog - Blog on the Web, we answer some but not all of these questions using Alteryx Designer.
Note: While most humans and software programs refer to vertically oriented data as being in columns, Alteryx describes this data as fields. I will use column and field interchangeably. I will also switch between first and second person liberally. Get excited!!
Steps:
- Finding Every Boston Market Using URL Scraping
- Geocoding Using the Census Bureau API
- Importing a .geojson File Into Alteryx
- Combining Line and Point Data Using the Find Nearest Tool
- Final Thoughts
- Files
Finding Every Boston Market Using URL Scraping
20 years ago, 250 million Americans ate at Boston Market up to 8 times a week. Comedians told jokes not about a multitude of Starbucks on adjacent streetcorners, but instead boundless Boston Markets. On humid summer nights, the pungent and permeating odor of slowly roasting, lightly herbed chickens smothered the nostrils of every parent and child, every bird in the sky and mole in the ground. While Boston Market once dominated the dimensional plane in which all fast casual restaurants simultaneously exist, it is now a feeble, aged giant - ready to blink out of existence any day. With so many franchise locations having closed over the last decades, it can be hard to keep track of which ones are still open. There is no easily accesible master list, and google results include many which are permanently closed.
With certifiable information unavailable, we must turn to the only possible cannonical source of Boston Market information - Boston Market. Each Boston Market location has it's own page on the Boston Market website, with it's address embedded as part of the URL. The answer has been inside you the whole time Boston Market! In order to get a list of all the locations, I crawled the Boston Market Locations page using XML-Sitemaps and was given a plaintext list of about 500 URLs. I copied and pasted those into an excel sheet - I probably could have done Alteryx Text Input here, but old habits - and was off, already tasting that signature blend of herbs and spices.
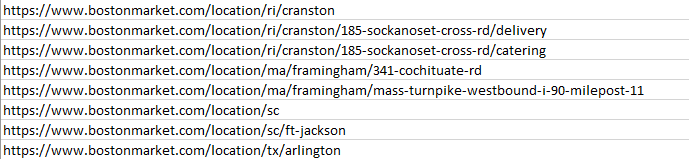
Play along at home - Bostonmarketurls.xlsx
Geocoding Using the Census Bureau API
In order to take this list of URLs containing address information and turn it spatial data, the addresses must be extracted, cleaned, and geocoded. Geocoding is a process wherein an address is provided and latitude/longitude points are spat out. The US Census Bureau has a handy API for geocoding that we will be utilizing once we have the addresses.
The complete workflow (click to embiggen):
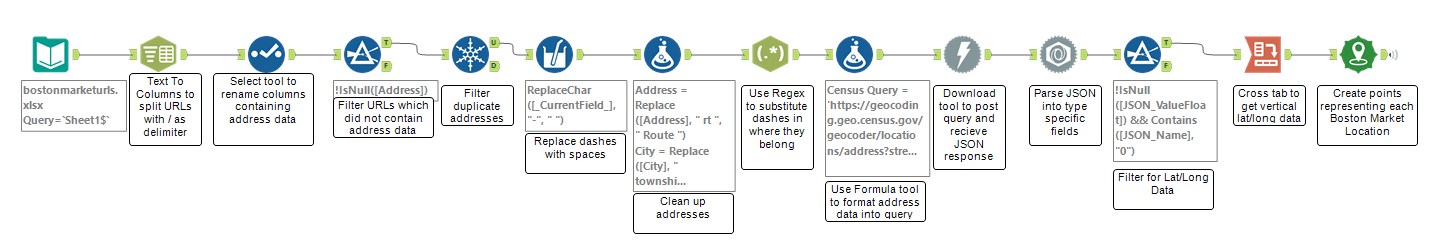
Lets get this out onto a tray of comprehensible chunks.
- Splitting URLs and filtering for adresses
- Cleaning up address data and preparing for Census Bureau query
- Parsing the Census Bureau JSON output and creating points
Chunk 1: Splitting URLs and filtering for addresses
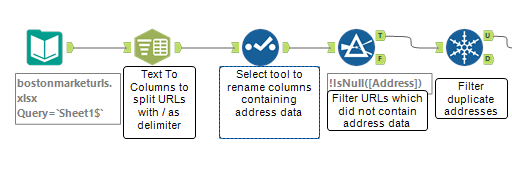
- Use the input data tool to load bostonmarketurls.xlsx into the workflow with default settings.
- Text to Columns tool with / set as delimiter, splitting the URLs into 8 columns. This gives us a column each for State, City, and Address, which we rename and select with the Select tool.
- Not all of the URLs have complete address info, so we use a filter on the Address column to find those entries for which the Address field is not null.
- Some Boston Markets have the same address listed multiple times for catering purposes, so we use the Unique tool on the Address column to filter for only unique addresses.
Chunk 2: Cleaning up address data and preparing for Census Bureau query
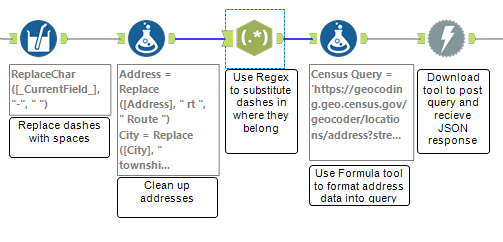
- Since both the City and Address fields contain dashes where there should be spaces, we use the Multi-Field Formula tool to with the expression
ReplaceChar([_CurrentField_], "-", " ")to replace all dashes with spaces. - Street addresses on routes have been abbreviated to rt, so I de-abbrev them with a formula tool using:
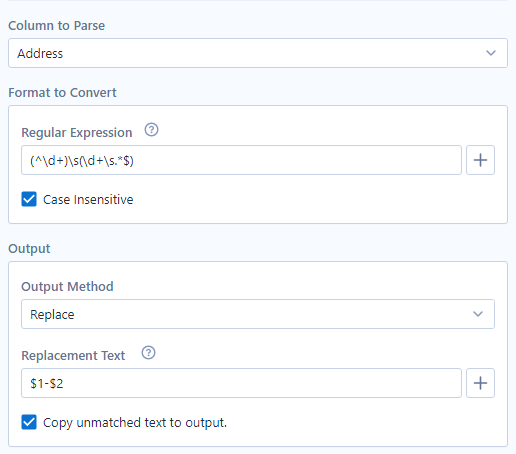
Replace([Address], " rt ", " Route "). Townships get the opposite treatment, since I like to seem them as twp. - Our earlier Multi-Field Formula was a little too aggressive in removing dashes, so we use the Regex tool to replace some of the dashes where they belong. Some addresses, particularly those in New York City, feature a dash between two sets of numbers, for example 106-24 71st Avenue. The Regex tool will search for two sets of numbers at the beginning of an entry and replace the space between them with a dash if we configure it juuuuust right:
- What if we used Formula tool to create a new column - Census Query - that combines our cleaned address data and formats it for the Census Bureau API? I imagine it would go a little something like this
'https://geocoding.geo.census.gov/geocoder/locations/address?street='+[Address]+'&city='+[City]+'&state='+[State]+'&benchmark=9&format=json' - Finally, we use the Download tool on our newly created Census Query column and get a response of JSON data so fresh and piping hot that it is comparable only to a delicious Boston Market rotisserie chicken. When running this workflow, right click on the download tool and select 'Cache and Run Workflow' so you only run this set of queries once.
Chunk 3: Parsing the Census Bureau JSON output and creating points
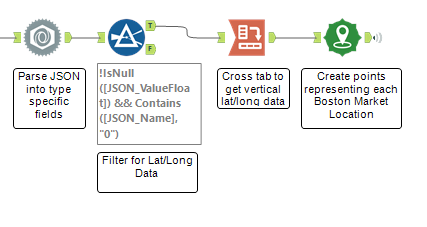
- Use the Parse JSON tool to well, parse the JSON provided by the Census Bureau. Since we only want float lat/long data, we output the values into data type specific fields for easy filtering.
- Using a custom filter in the Filter Tool, we select only entries containing lat/long data. Additionally, the census bureau has provided us with different possible geocoded values for some of the addresses. We only want one point per address, so we lazily take the first geocoded match for each address by selecting entries numbered 0 -
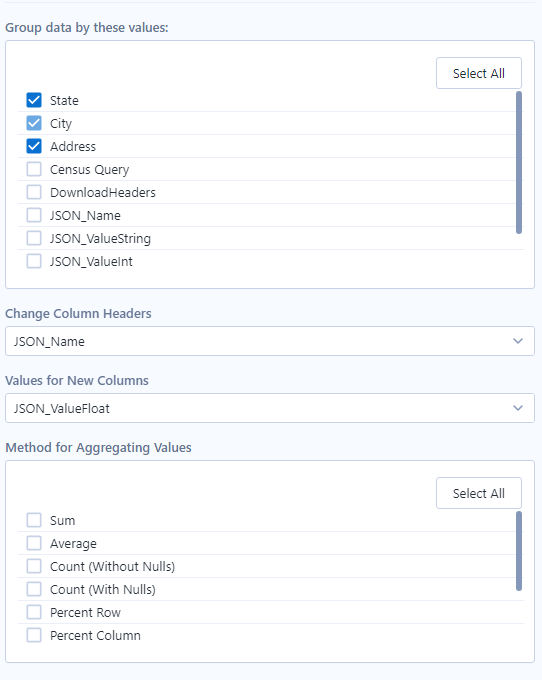
!IsNull([JSON_ValueFloat]) && Contains([JSON_Name], "0") - With the Cross Tab tool we take the alternating lat/long entries and combine them into one line apiece. Configuring it as follows should do the trick:
- In order to finalize our greasy Boston Market data, we create spatial points using the aptly named Create Points tool. Our coordinates are floating point, so make sure they are set as such within the Creat Points tool. After this is run, we will have a centroid for each Boston Market location, ready to compare to our route.
Importing a .geojson File Into Alteryx
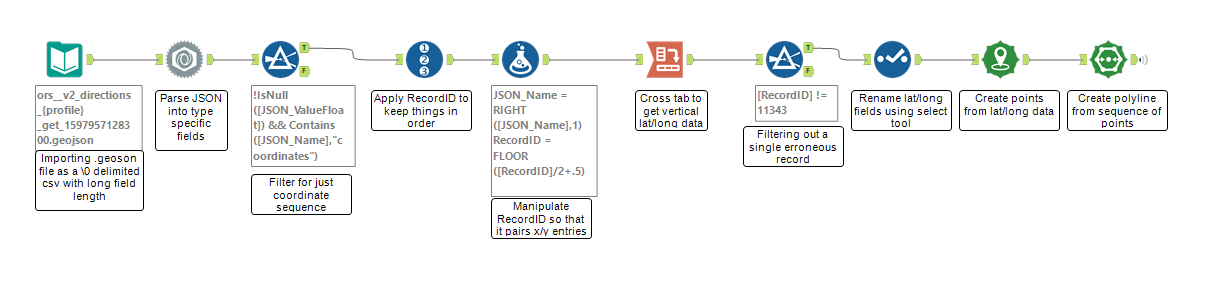
- We generate a route (St Paul to New York) using openrouteservice.org, which yields a .geojson file. While Alteryx does not have native support for .geojson files, we can import it using the input data tool as a csv with no delimiters. This will read the .geojson file as a single, very long entry, so make sure to uncheck First Row Contains Field Names and make the Field Length quite long. I went with 1,000,000.
- We will again use the Parse JSON tool with the data type specific fields settings to isolate lat/long floating point data, and a custom filter to select only the coordinate data.
!IsNull([JSON_ValueFloat]) && Contains([JSON_Name],"coordinates") - We hit these records with a little bit of the ole RecordID tool to maintain a sequence of points. Since each x coordinate is on a separate entry from each y coordinate but we want them to be a single record, we apply this formula to the RecordID column to make pairs:
FLOOR([RecordID]/2+.5). We only need the final digit from the JSON_Name column in order to differentiate between lat and long coordinates, so we use this formula to get the final digit from the JSON_Name column:RIGHT([JSON_Name],1) - Cross tab comes back with a vengeance! Grouping data by RecordID and changing column headers to JSON_Name, with JSON_ValueFloat as the values for new columns gives us the result we want - each lat/long coordinate as a paired entry. We remove a single erroneous point with a quick filter for RecordID and use the Select tool to provide more descriptive names.
- We again use the Create Points tool and follow that up with the Poly-Build Tool, using the sequence polyline build method since we want a line tracing our route. The sequence field is RecordID.
Combining Line and Point Data Using the Find Nearest Tool
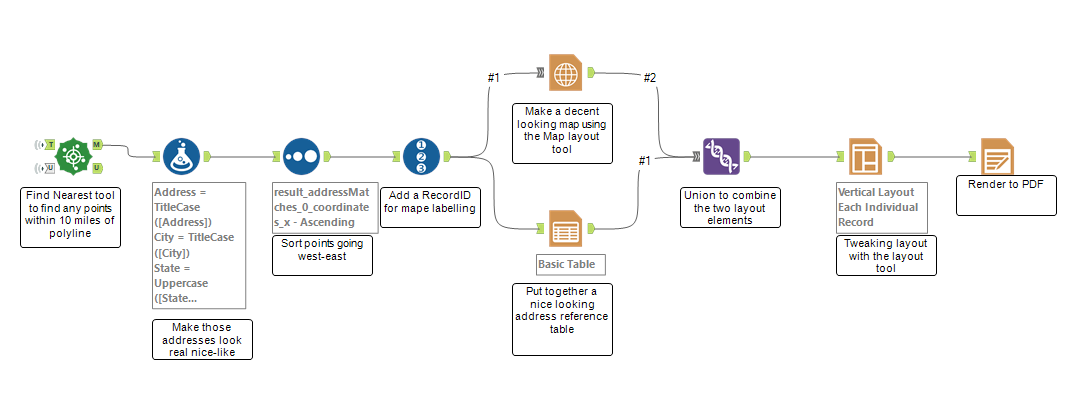
- The Find Nearest tool takes two inputs, targets and universe. Our targets will be the list of Boston Market points we generated earlier, and our universe is the polyline route. Since I'm looking for only the most convenient Boston Markets, I set the distance to search to 10 miles.
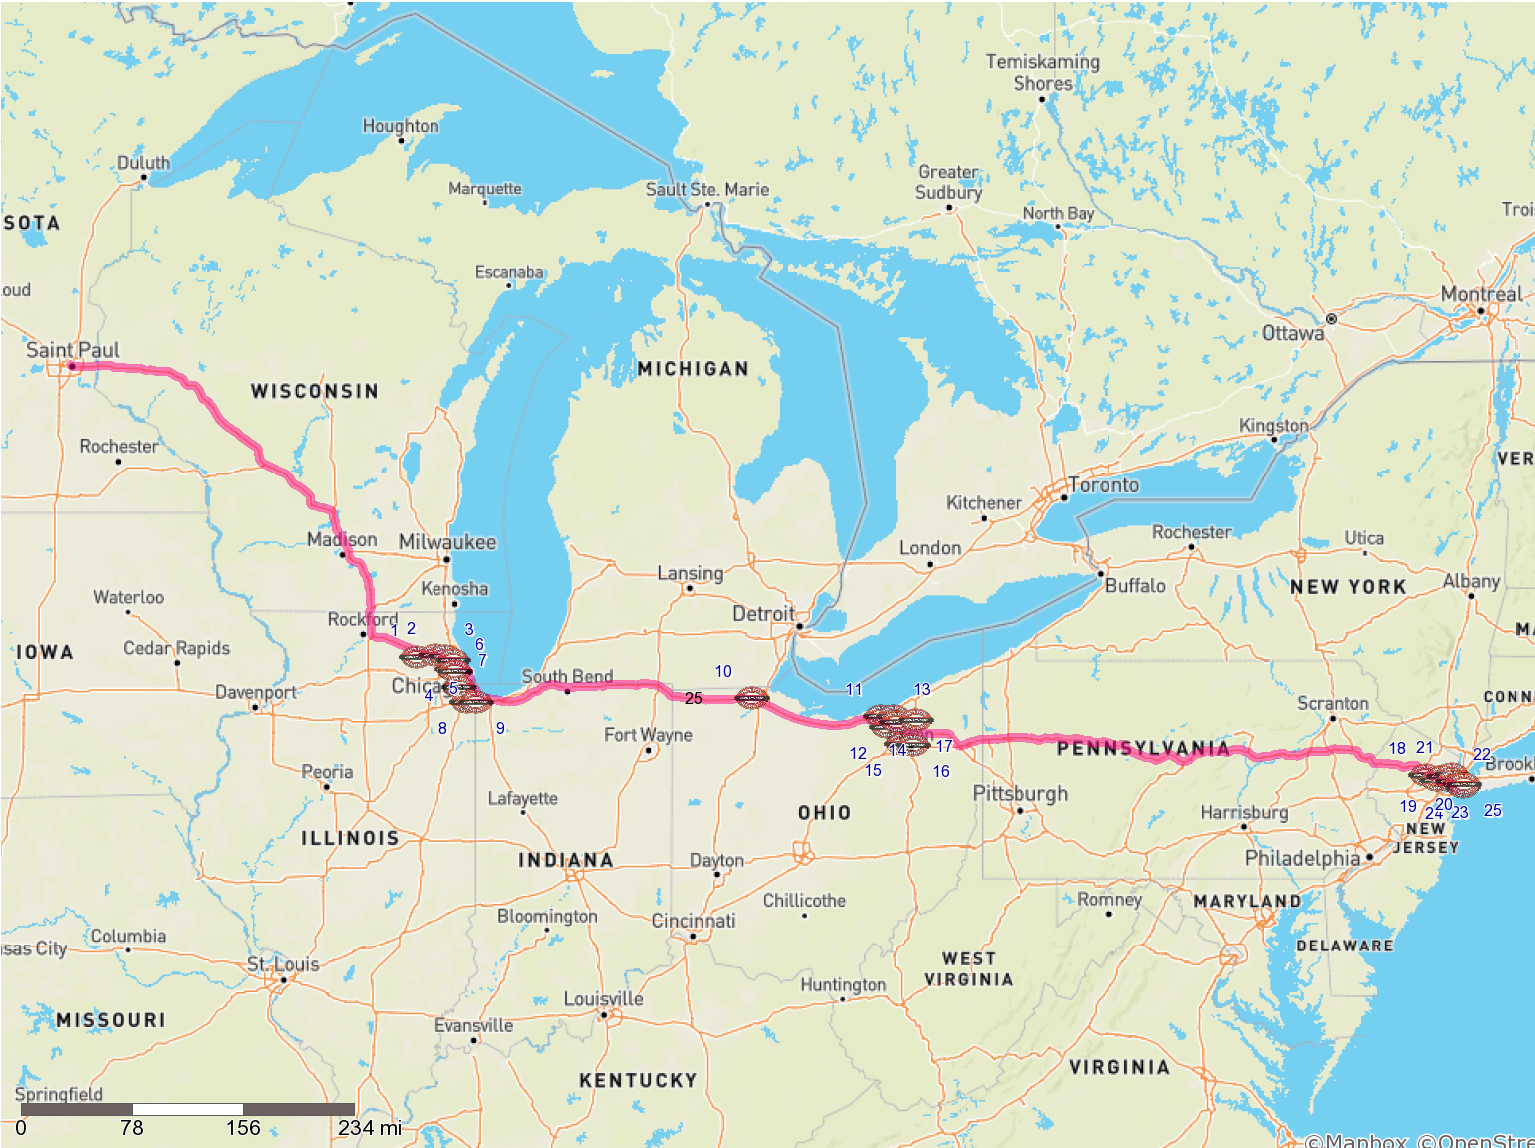
- By jove, we have it! A list of all the Boston Market locations within 10 miles of the route between St Paul and New York. We can clean up the entries to make a nice table using TitleCase as a function in the Formula Tool and then sort by ascending longtitude to get our list moving West to East. Pop another RecordID on the points are easily referenced on our about to be produced map and we are done manipulating the data. At this point if you have access to any better mapping or reporting software I would reccomend using it instead of Alteryx, but we will stubbornly proceed onwards.
- We use the Map layout and Table layout tools with our data stream to make a map and a table, stack them with the Union tool, and output those with the Vertical Layout tool and finish it up with a Render tool, yielding:
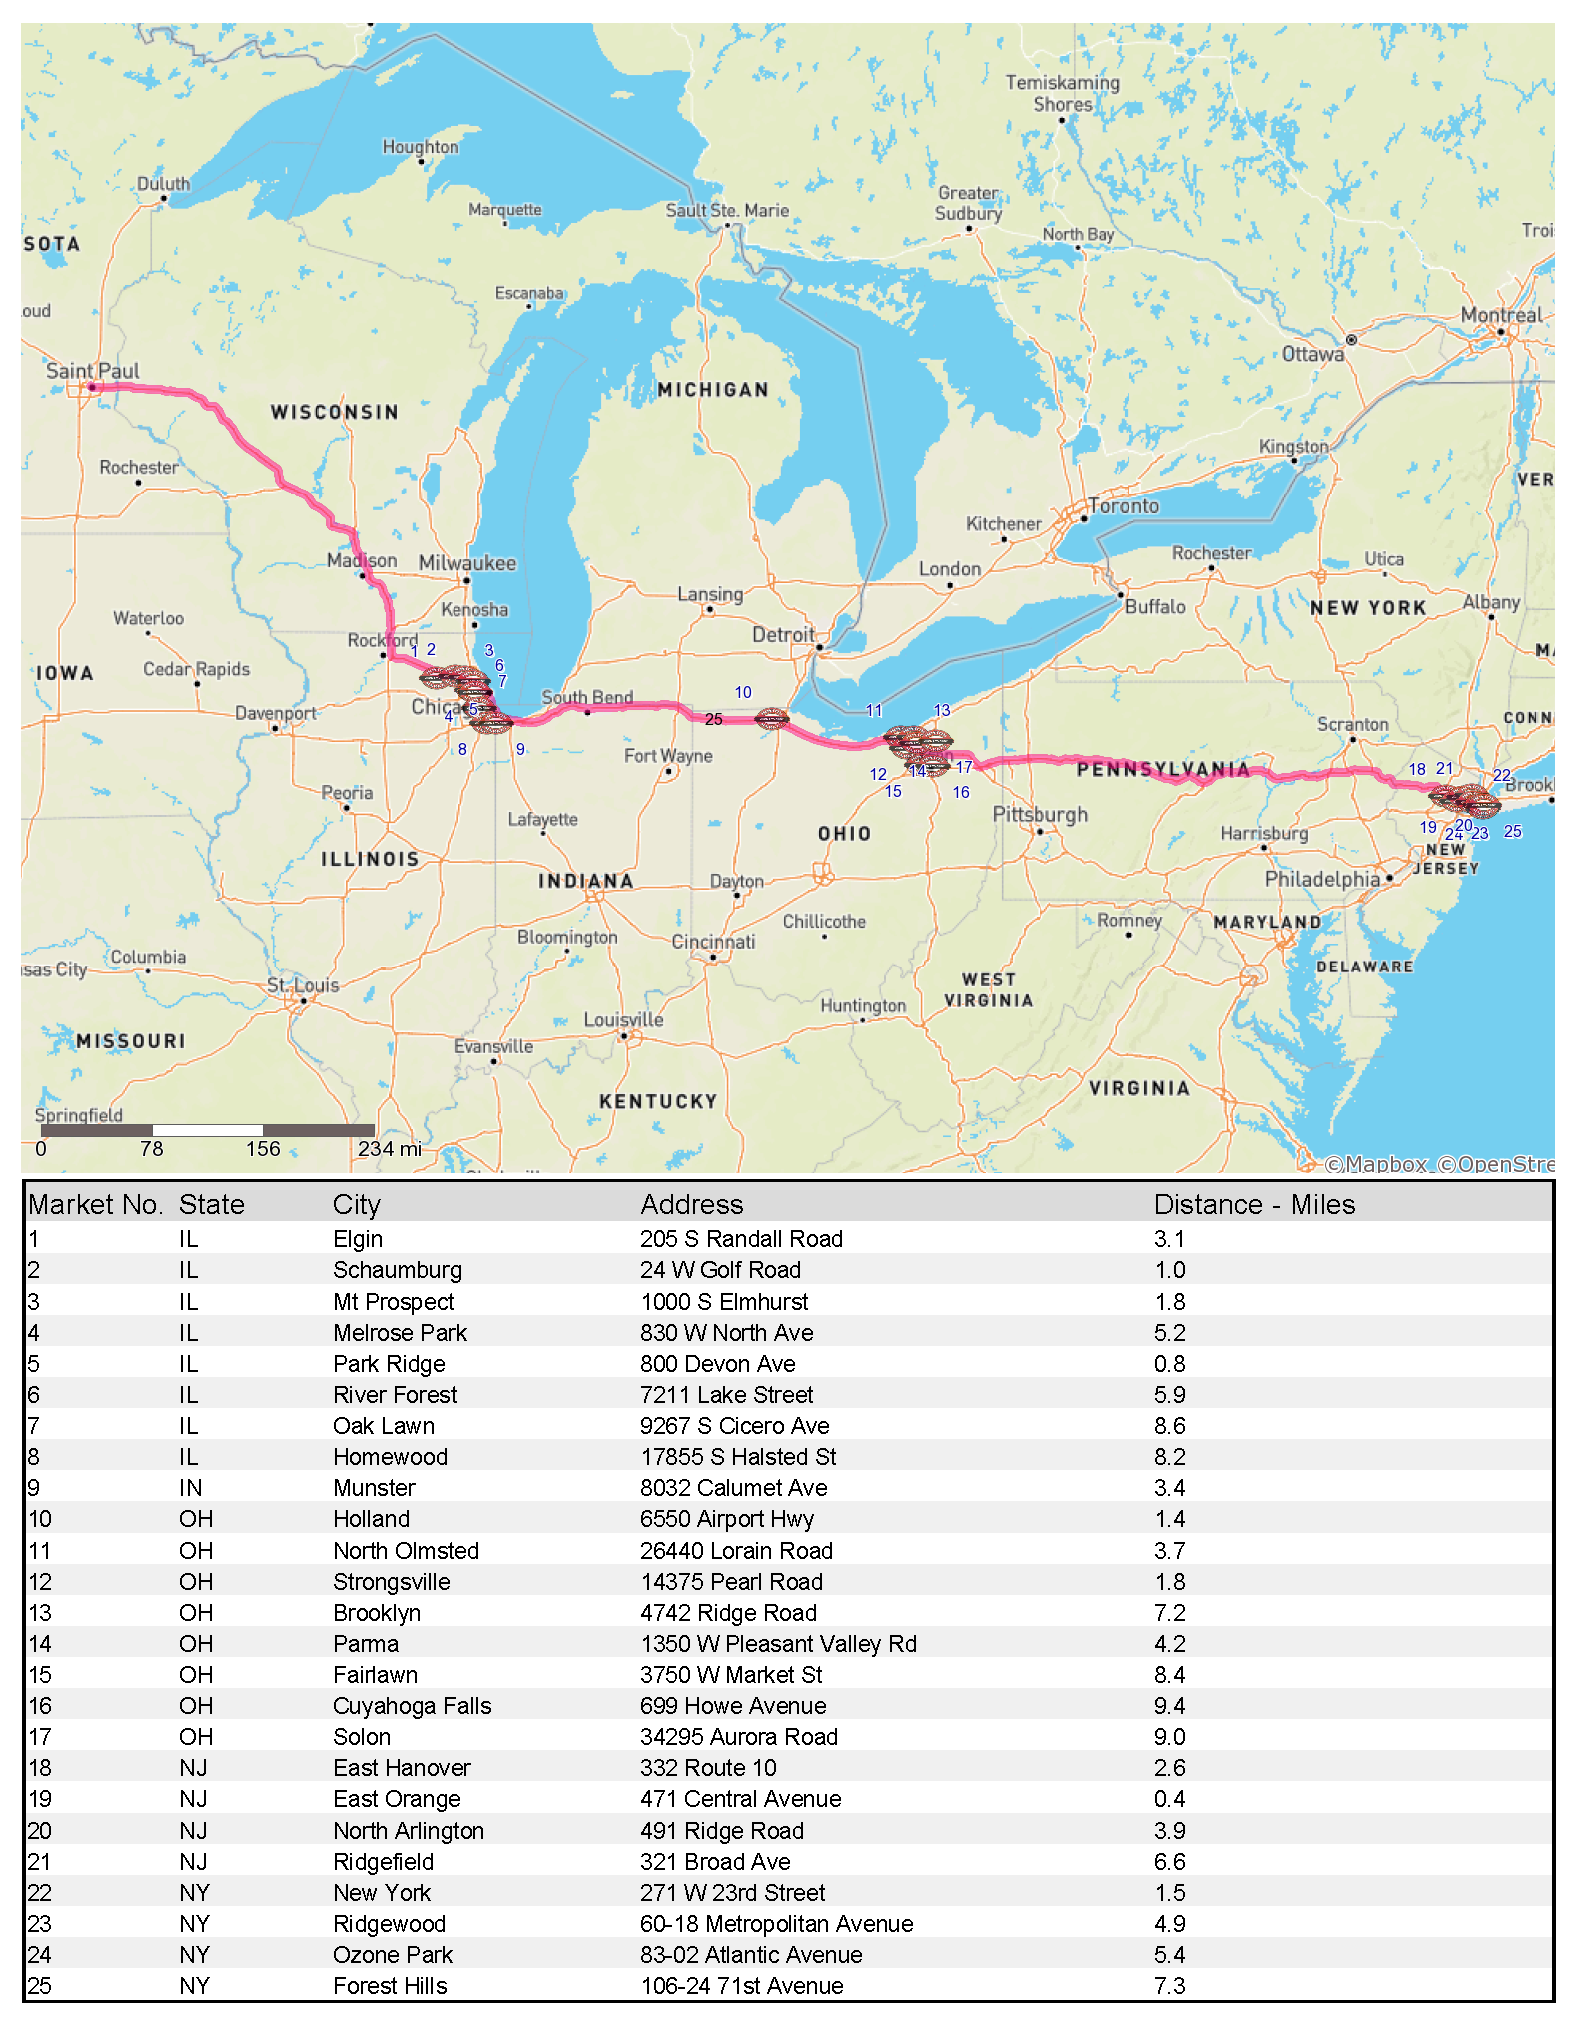 Wow! 25 convenient markets!
Final Thoughts
This was a fun project, but not all my questions were answered. I still don't know if I can get extra skin at the Boston Markets along the way, and I don't think Alteryx can ever tell me that! Due to the limitations of the Alteryx map tool my map does not look amazing, and there is an extra "25" labelled on the map for unknown reasons. The address scraping wasn't perfect, and if this had been a real job instead of a fun, fun, fun project I would have done more hand-checking of the data. But, if we've learned anything from this project its that neither about the journey nor the destination, but instead, all about Boston Market.
Files:
Complete Alteryx Workflow Package - Includes URL List and Route
About the Author: Tony Albanese is a freelance data consultant and researcher specializing in the legal industry. Contact info AT antalb.com